When we look at the test results of national standardized tests, it’s obvious that we are failing our children in achievement of their potential. No other conclusion is possible. (Take a look at the chart in my last post.)
Since the first of the year, I have been focused on the failures resulting from our lagging education system, and they are massive. Just to review, two-thirds of our students in fourth and eighth grade can’t read with proficiency. Furthermore, we are accelerating the weakening of our English curricula.
The result is that our students can’t read, which means they can’t learn with any efficiency. Since they have no facility with the language, we may as well trash the culture and history as well.
Many of us are also concerned with equity in education. We were hoping for an improvement in overall achievement levels, bringing our worst students up to a higher standard. Instead, it appears the public education system will go the other way and lessen the outcomes for all.
What Is the Purpose of Public Education?
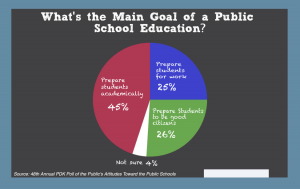
That’s a really simple question with a really complex answer. The purpose of public education seems to be many different things to many different people. And, in fact, neither the public, the educators, nor the government have settled on one mission statement.
In 2010, a writer for the HuffPost was attracted to the question. Heather Wolpert-Gawron did an informal survey of about 300 people and developed an extensive list of twenty objectives, nineteen of which were mentioned repeatedly. These included references to such high-minded ideals as “skills for passionate advocacy” and “love of exploration” to more practical objectives like personal responsibility and critical thinking.
Last on the list of twenty objectives, and mentioned by only one of the 300 respondents, was this: Teach reading, writing, and math.
Why Don’t We Know We Are Failing Our Children in Achievement?
Since we don’t have a common understanding of our objectives in public education, it may be difficult for us to understand we are failing. After all, you can’t hit a target you can’t see; likewise, you can’t know that you missed it either.
Besides, actual goals must be quantitative and measurable. Otherwise, they are simply that vague destination out there in the fog of daily activity.
Nevertheless, there are some warning flags that we could see if we just looked!
The most readily available should be our dropout rate. Edweek has an easily understood graphic showing that our graduation rate peaked in 1969 at 77.1%. Their chart shows a falloff after that time, with a graduation rate of 68.8% in 2007.
In 2010, however, the government changed the way they calculate graduation rates. It’s a fancy combination of figures and limits that produces a current graduation rate of 85%, which looks like quite an improvement. I think it’s a bit deceiving, since it only counts first-time freshman who graduate in four years. You can see for yourself here.
But what about the NAEP, which I’ve talked about many times? We give it every two years to fourth- and eighth graders to test their reading and math. Well, we’ve had no improvement in reading or math since 1992. In fact, the scores for the 2019 test showed no improvement in math and a 2% drop in reading. It’s important to note that about two-thirds of our students do not achieve proficiency in either subject.
That sounds like failure to me.
What These Statistics Don’t Tell You Failing Our Children in Achievement
It’s easy for us to conclude that we can trust statistics. It’s also true, though, that a statistic is just one view of a subject, and it always depends how you ask the question. As it relates to achievement in education, it matters how the calculation was done, what factors were included, and what factors were excluded.
Our current 85% graduation rate doesn’t tell us how many freshmen were not first timers; it doesn’t tell us how many students never achieved freshman status. Worse yet, it gives us no indication of the quality of the education these students received—only that they did it in four years.
Moreover, we know these statistics represent an average of what is being accomplished. In the 2007 graduation rate of 68.8%, only 55% of Hispanic students graduated and only 53% of African-American students.
The results for the NAEP for the past 28 years show a similar pattern. On average, only 35% of our fourth graders can read efficiently. The figures for Hispanics and African-Americans are less, which means their prospects for success are less.
In 2018, Condoleezza Rice, who served as Stanford University’s provost and a U.S. Secretary of State, among numerous other high-profile positions, spoke at the Reagan Foundation’s first summit on education. EdWeek quoted her saying this:
“We can’t have any more third graders who can’t read, we can’t have any more 18 or 19 year olds who go to college and come out without any skills, and [there] can’t be any more 35 year olds who can’t be re-trained by any of our 37 federal re-tooling programs we have, none of which seem to work very well.”
I agree with her. I also agree with Senate Committee on Health, Education, Labor and Pensions Chair Lamar Alexander (R-TN), who said the role of American public education is “to teach reading, writing, arithmetic and what it means to be an American citizen.”
So let’s review #20 above: Teach reading, writing, and math, and I’ll add citizenship. That’s the first and most important step to ensuring achievement and equality.
Contains information related to marketing campaigns of the user. These are shared with Google AdWords / Google Ads when the Google Ads and Google Analytics accounts are linked together.
90 days
__utma
ID used to identify users and sessions
2 years after last activity
__utmt
Used to monitor number of Google Analytics server requests
10 minutes
__utmb
Used to distinguish new sessions and visits. This cookie is set when the GA.js javascript library is loaded and there is no existing __utmb cookie. The cookie is updated every time data is sent to the Google Analytics server.
30 minutes after last activity
__utmc
Used only with old Urchin versions of Google Analytics and not with GA.js. Was used to distinguish between new sessions and visits at the end of a session.
End of session (browser)
__utmz
Contains information about the traffic source or campaign that directed user to the website. The cookie is set when the GA.js javascript is loaded and updated when data is sent to the Google Anaytics server
6 months after last activity
__utmv
Contains custom information set by the web developer via the _setCustomVar method in Google Analytics. This cookie is updated every time new data is sent to the Google Analytics server.
2 years after last activity
__utmx
Used to determine whether a user is included in an A / B or Multivariate test.
18 months
_ga
ID used to identify users
2 years
_gali
Used by Google Analytics to determine which links on a page are being clicked
30 seconds
_ga_
ID used to identify users
2 years
_gid
ID used to identify users for 24 hours after last activity
24 hours
_gat
Used to monitor number of Google Analytics server requests when using Google Tag Manager