We’ve looked at the racial achievement gap from a couple of different angles. Based on the attention this particular measurement gets, you might assume that race is the deciding factor in education. I think you might be wrong. When you look at the low-income achievement gap, you get a different picture.
When the SAT and the NAEP analyze their data, they divide results into groups. The College Board (SAT) establishes groups based on race/ethnicity and also on gender. The NAEP, however, analyzes scores based on nine different metrics. While they include race and gender, they also study seven other parameters, including NSLP (National School Lunch Program) eligibility.
The NSLP isn’t a perfect income level statistic, but it’s a pretty good one. Students qualify for free or reduced-price lunches based on their family size and income. NAEP uses this as a reasonable standard for determining students from lower-income families.
How Serious Is the Low-Income Achievement Gap?
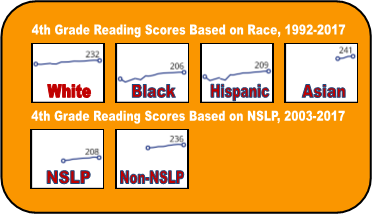
As our testing experts continue to group students and draw interesting graphs, they seldom cross reference the information. The graphic here shows the disparities between the average scores based on race as well as those based on the free lunch program.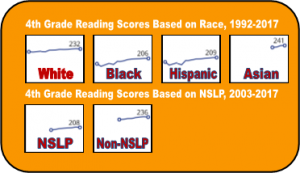
You can see that the difference between the scores of white students and black students is 26 points. Between white students and Hispanic students, it is 23. This is not great news. However, a review of the detailed graph shows that white vs. black gap has been reduced 9 points since 1994. The white/Hispanic gap has shrunk by 13 points.
Looking at the average score graphs for the free lunch program, it’s clear that this gap is even greater. The difference is currently 28 points. Unfortunately, it hasn’t changed since the first measurement. Thus, while the racial achievement gap has closed a bit, nothing has changed for low-income achievement disparities.
In addition, there’s more bad news. In only one of the six graphs shown did the average group score rise to the level of proficiency—the Asian students. Let me translate: the average reading scores for white students, black students, and Hispanic students is below the proficiency standard.
Who Are These Low-Income Students?
It’s easy, even logical to assume that our minority students make up most of the low-achieving, low-income students each year. To examine this, I’ve made a different assumption; I’ve assumed that, based on the poverty figures by race, the student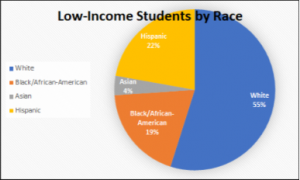
This is probably not perfect, but it still gives an idea about who are low achievers are. Here is the graph those figures generated.
What can we conclude from this?
- Income, as well as race, is a significant factor in student achievement.
- While we are making small progress in racial achievement disparities, we are making none in low-income achievement.
- Too many of our fourth graders have not achieved proficiency in reading. Our students cannot succeed without solid reading and language skills.
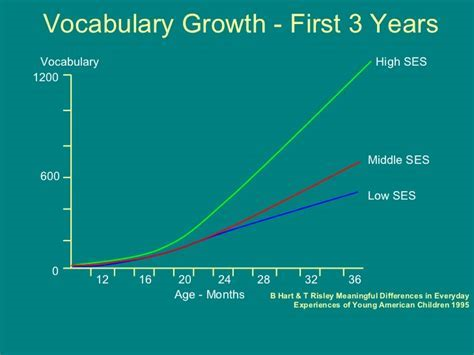
- We need more language development in our preschool programs and primary grades.
We must start our children early, especially our low-income students, and reading and language development if we are every to raise them to a proficient standard and the prospect of academic success.